Python source code: contour_pole_figure.py
from pymicro.crystal.texture import PoleFigure
from pymicro.crystal.microstructure import Microstructure, Grain, Orientation
from matplotlib import pyplot as plt
"""
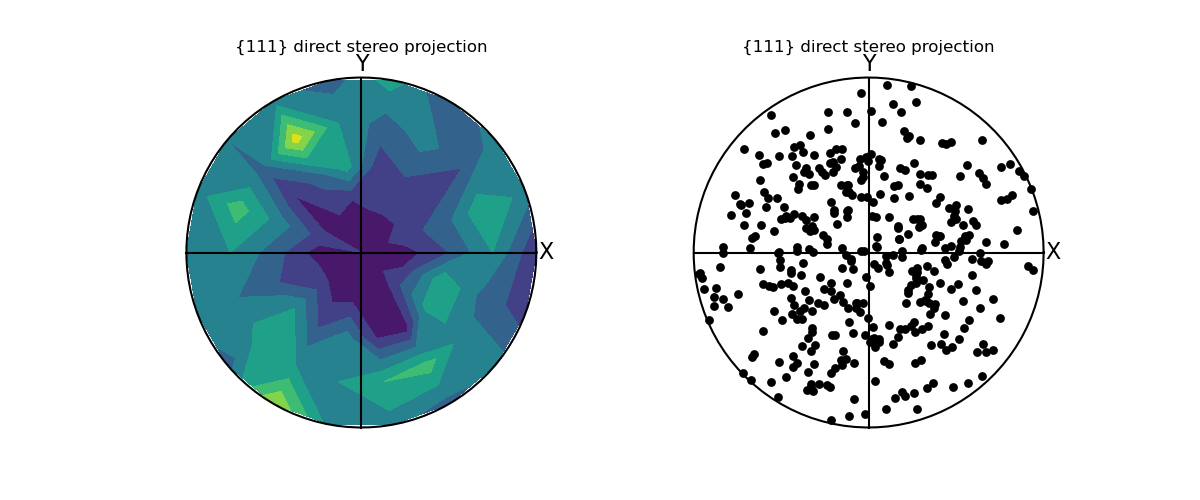
A pole figure plotted using contours.
.. note::
Use this example carefully since this is just using a matplotlib contourf
function, and has not been tested properly.
"""
euler_list = np.genfromtxt('../data/pp100', usecols=(0, 1, 2))
micro = Microstructure(name='test', autodelete=True)
micro.add_grains(euler_list)
pf = PoleFigure(hkl='111', proj='stereo', microstructure=micro)
pf.mksize = 40
fig = plt.figure(1, figsize=(12, 5))
ax1 = fig.add_subplot(121, aspect='equal')
ax2 = fig.add_subplot(122, aspect='equal')
pf.create_pf_contour(ax=ax1, ang_step=20)
pf.plot_pf(ax=ax2)
image_name = os.path.splitext(__file__)[0] + '.png'
print('writting %s' % image_name)
plt.savefig(image_name, format='png')
from matplotlib import image
image.thumbnail(image_name, 'thumb_' + image_name, 0.2)
del pf, micro