Python source code: cos_fitting.py
from matplotlib import pyplot as plt
from pymicro.xray.fitting import fit
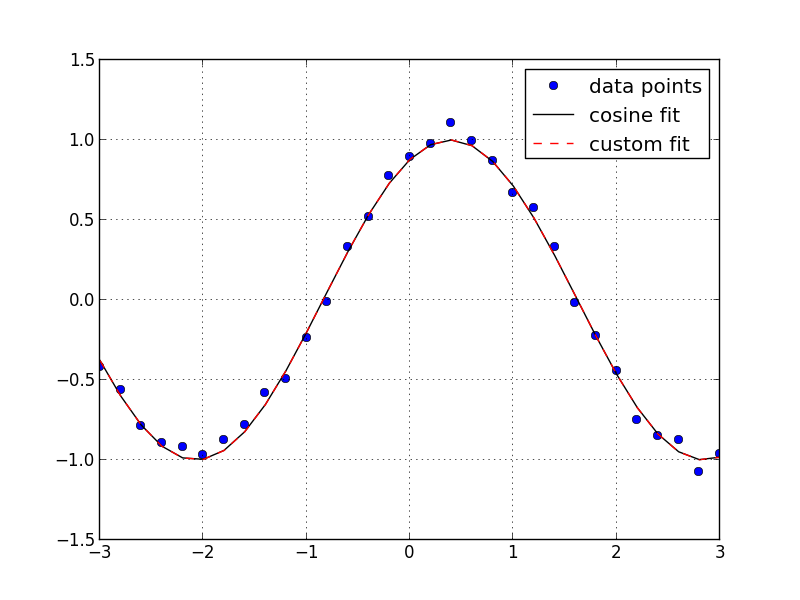
'''Basic curve fitting example with a cosine function. The data is
also fitted with a custom function slightly different than the default
Cosine, which lead to the same result.'''
x = np.linspace(-3.0, 3.0, 31)
# generate some noisy data
np.random.seed(13)
y = np.cos(4 * x / np.pi - 0.5) + 0.05 * np.random.randn(len(x))
# custom function
def C(x, p):
return np.sin(np.pi * (x - p[0].value) / (2 * p[1].value)) * p[2].value
# perform fitting
F = fit(y, x, expression=C, nb_params=3)
C = fit(y, x, expression='Cosine')
plt.plot(x, y, 'bo', label='data points')
plt.plot(x, C(x), 'k-', label='cosine fit')
plt.plot(x, F(x), 'r--', label='custom fit')
plt.xlim(-3, 3)
plt.grid()
plt.legend(numpoints=1)
image_name = os.path.splitext(__file__)[0] + '.png'
print('writting %s' % image_name)
plt.savefig(image_name, format='png')
from matplotlib import image
image.thumbnail(image_name, 'thumb_' + image_name, 0.2)