Convention to read and write 2d images with pyplot
- When dealing with 3d images, pymicro uses the following convention:
the array in memory represents (x,y,z) data.
the data is written to the disk as a succession of (x,y) slices, x being the fastest moving index.
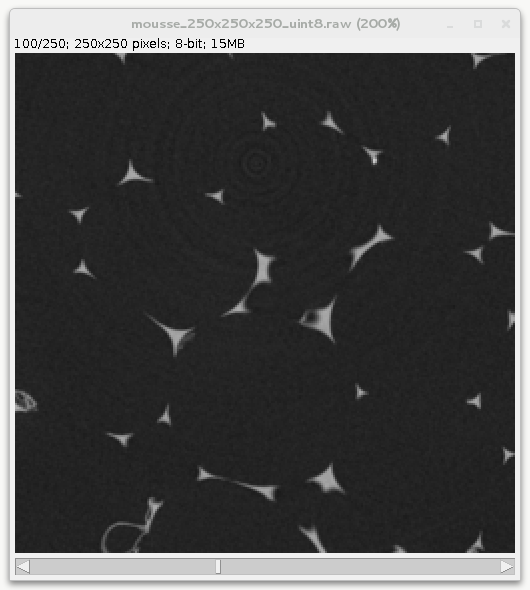
This matches ImageJ convention when looking at the data. For instance looking at the 100th slice of the foam data set:
When writting 2d images such as tif, jpg or png, out of a numpy array one may use existing function from matplotlib.pyplot, scipy.misc, etc… but careful checking needs to be done to remain consistent since pyplot assume a (y,x) array when plotting, writting, reading images.. This recipe demonstrate how to use the pyplot module to write / read 2d images. For other format than PNG, pyplot uses PIL under the hood so this should work with PIL as well.
Get the complete Python source code: convention_read_write_2d_images.py
In this example we use the foam 3d dataset with size 250x250x250. First you need to define the path to the 3d volume:
data_dir = '../../examples/data'
scan_name = 'mousse_250x250x250_uint8'
scan_path = os.path.join(data_dir, scan_name + '.raw')
Then load the volume in memory thanks to the :pymicro:file:file_utils:HST_read function. The zrange option is used here to load only the 100th slice.
vol = HST_read(scan_path, autoparse_filename=True, zrange=range(100, 101))
The slice is saved as a raster image (eg. png or jpg) using pyplot imsave function:
plt.imsave('%s.%s' % (scan_name, ext), np.transpose(vol[:, :, 0]), cmap=cm.gray)
The 2d image can now be loaded into memory as a numpy array using pyplot imread function:
im = np.transpose(plt.imread('%s.%s' % (scan_name, ext))[:, :, 0])
Note that imsave write png image as 4 RGBA (red, green, blue, alpha) using floatting point numbers between 0 and 1. Here we have selected only the first channel (R) since in gray level images R=G=B. To compare with our initial raw image we may just re-transforming it to 8 bits (between 0 and 255):
im_uint8 = (255 * im).astype(np.uint8)
We can print some of the pixel value to verify the data is well ordered in memory:
print 'in raw data: pixel value at [124,108] is %d, at [157,214] is %d' % (vol[124, 108, 0], vol[157, 214, 0])
print 'in 2d image: pixel value at [124,108] is %d, at [157,214] is %d' % (im_uint8[124, 108], im_uint8[157, 214])
Finally the data is compared using imshow both on the raw data and the numpy array read from the 2d image and plotting a profile along x:
plt.imshow(np.transpose(vol[:, :, 0]), cmap=cm.gray)
plt.imshow(im.T, cmap=cm.gray)
plt.plot(vol[:, 108, 0], label='raw data')
plt.plot(im_uint8[:, 108], label='%s image' % ext)
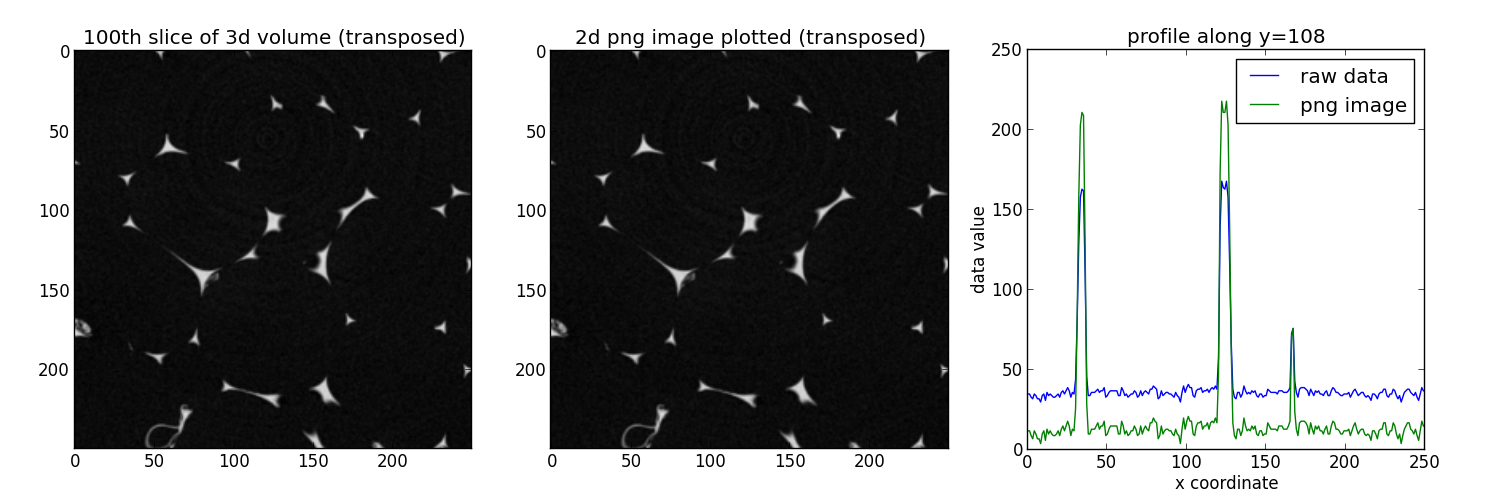
Everythings lloks in order, the changes in terms of values along x are normal since pyplot renormalize the data between 0 and 1 to write the png image (to minimize the loss of information).
In summary, 3d volumes are handled via (x,y,z) 3d numpy arrays in pymicro, pyplot assume a (y,x) array when plotting, writting, reading images. So if you care about having everything consistent you must transpose the arrays passed to pyplot.